

For loan officers and mortgage brokers

Stop sending spreadsheets.Give borrowers a mortgage comparison they can actually follow.

Create professional, branded mortgage presentations that make loan options, monthly payments, closing costs, and long-term costs easier for your borrowers to understand.

3-day free trial. No credit card required. $25 a month or $150 a year after that.

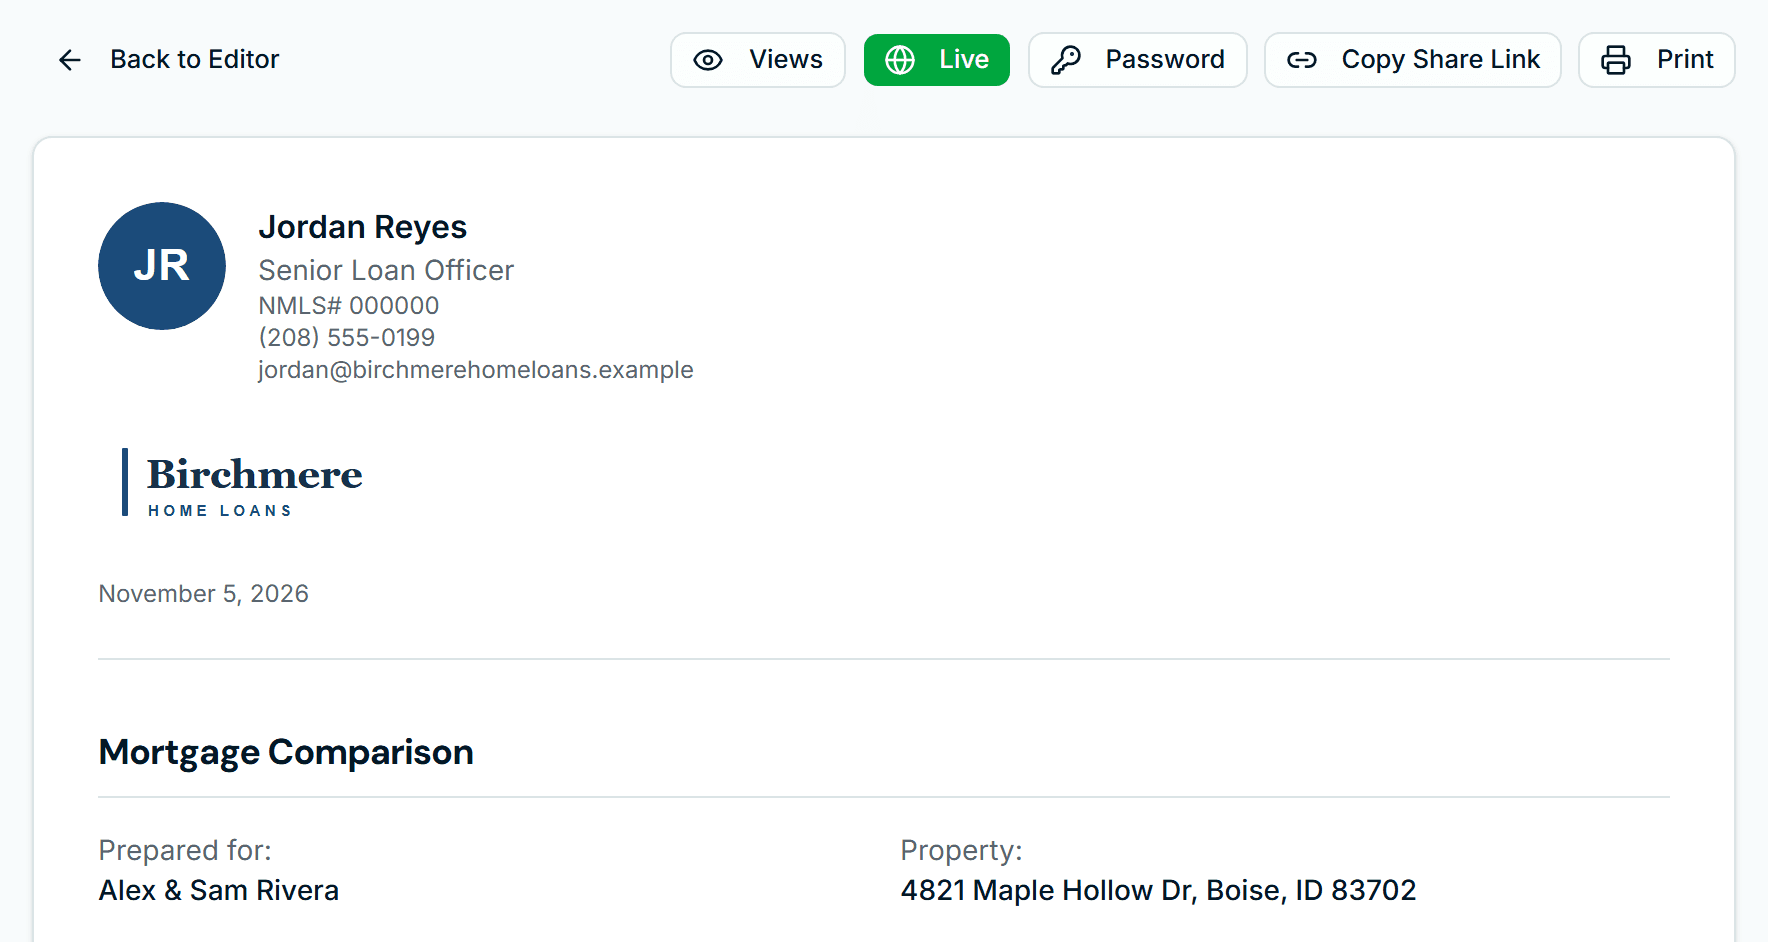
Presentation header with the loan officer's headshot, name, NMLS number, contact details and company logo.Mortgage comparison prepared for Alex and Sam Rivera for 4821 Maple Hollow Drive.
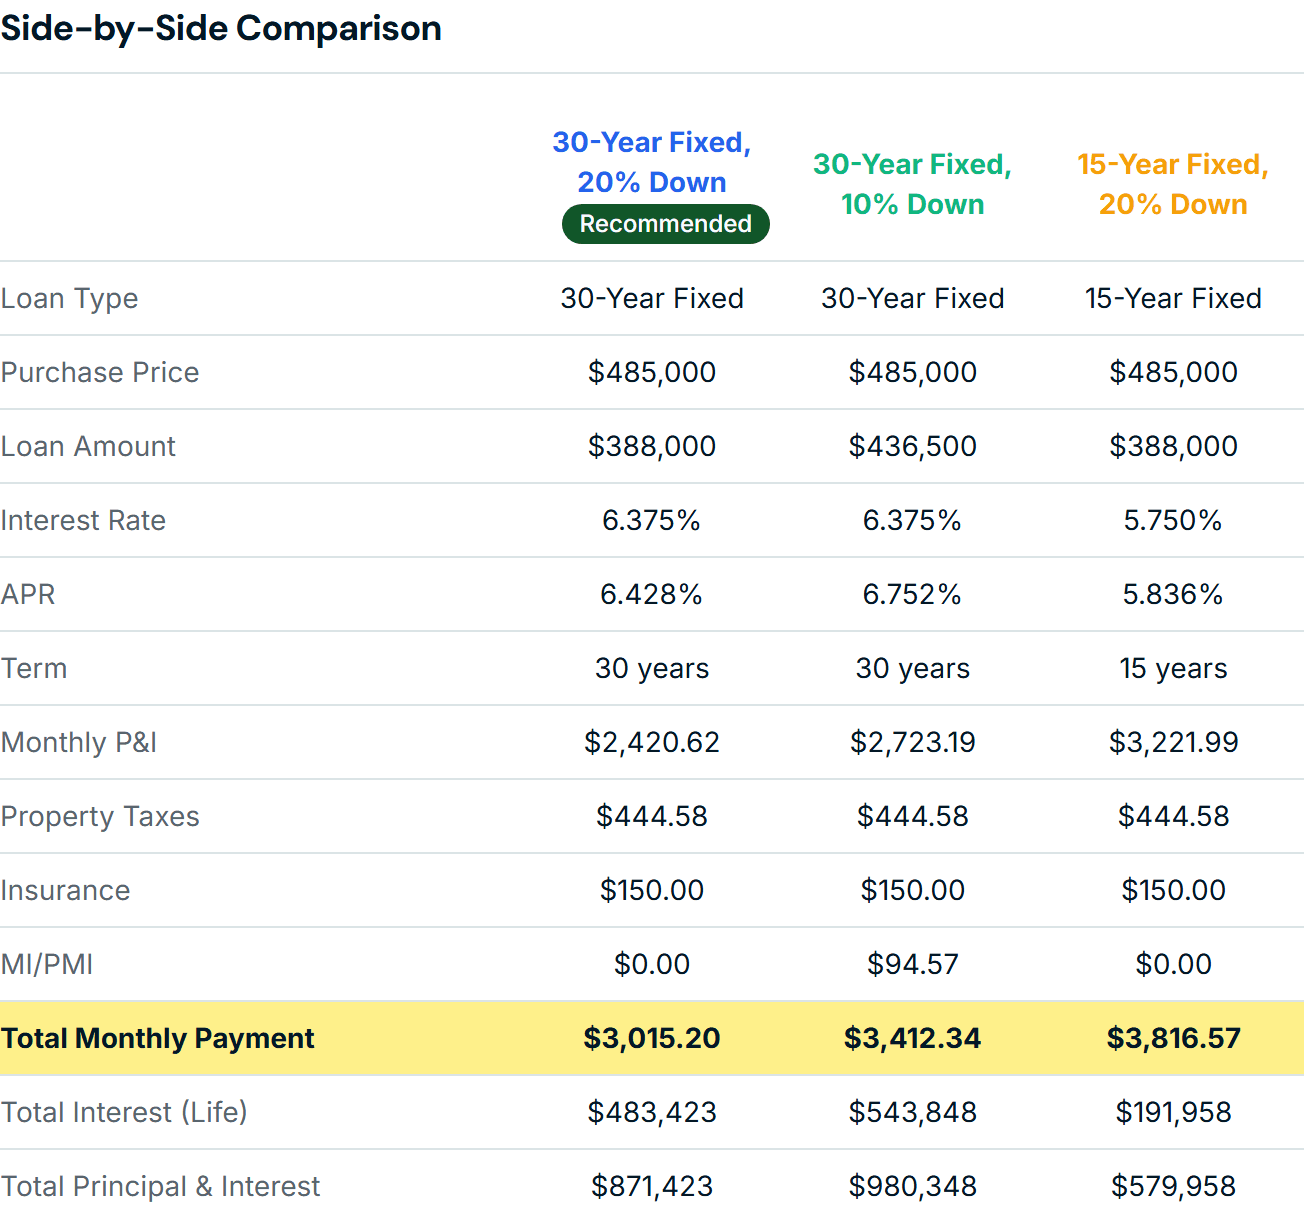
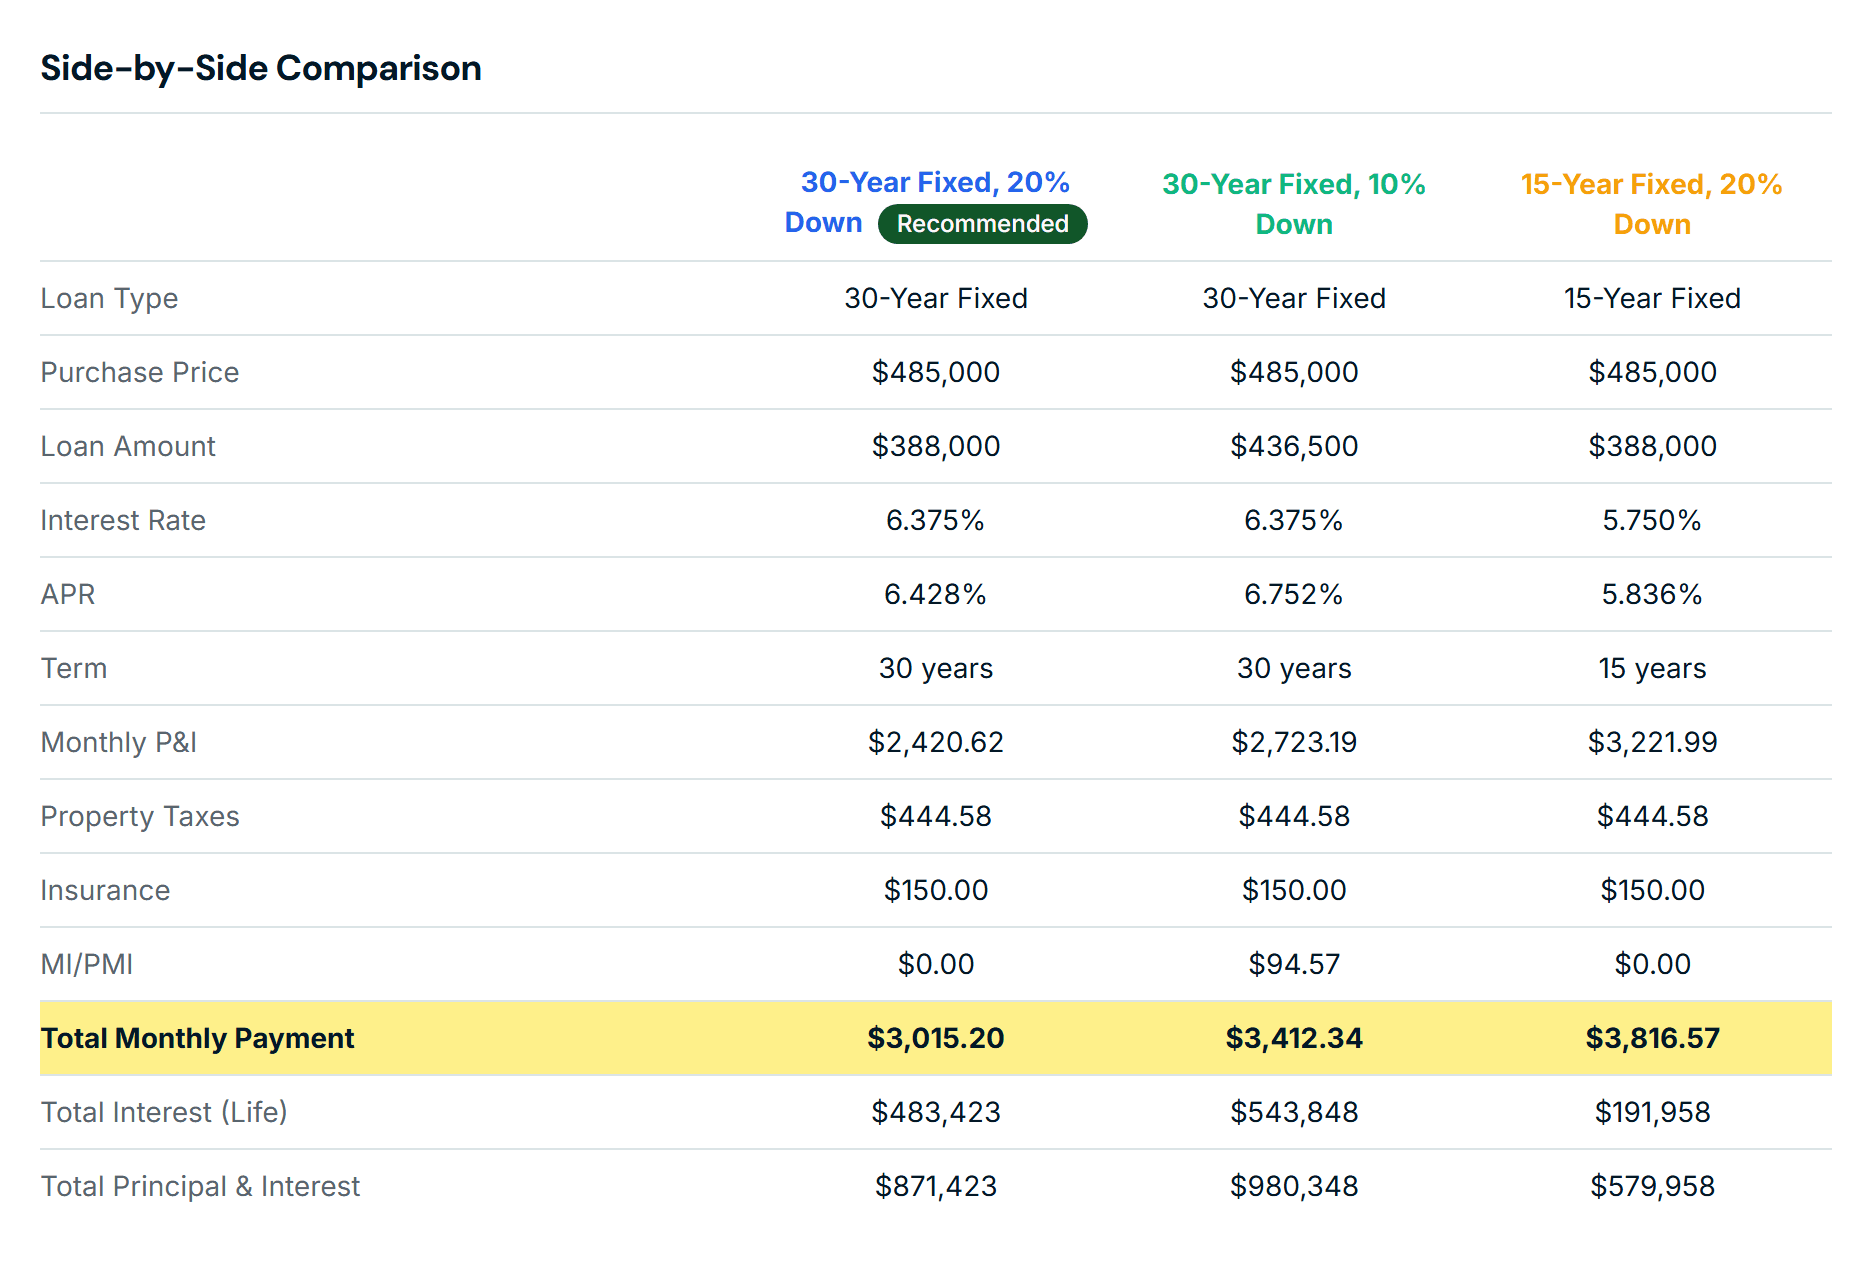
Side-by-side comparison of three loan options: loan amount, interest rate, APR, term, monthly payment with taxes, insurance and mortgage insurance, total monthly payment, total interest and total principal and interest.
The page a borrower opens from your link. Fictitious borrower, loan officer and figures. Open the full sample.

The borrower's view

This is what your client sees.

Instead of a spreadsheet or a stack of loan estimates, your borrower opens one page with their options side by side and every number in the same place.

  1. 01Loan options side by side, in the same order every time
  2. 02Interest rate, APR and the full monthly payment for each option
  3. 03Closing costs itemized like a Loan Estimate, down to cash to close
  4. 04Total interest and total cost over the life of each loan
  5. 05Amortization, remaining balance and equity projections
  6. 06Charts that show the differences without a walkthrough
Open the sample presentation
Side-by-side comparison of three loan options with a recommended option, monthly payment breakdown, highlighted total monthly payment, total interest and total principal and interest.
Loan options side by side, with your recommended option marked and the rows you chose highlighted.
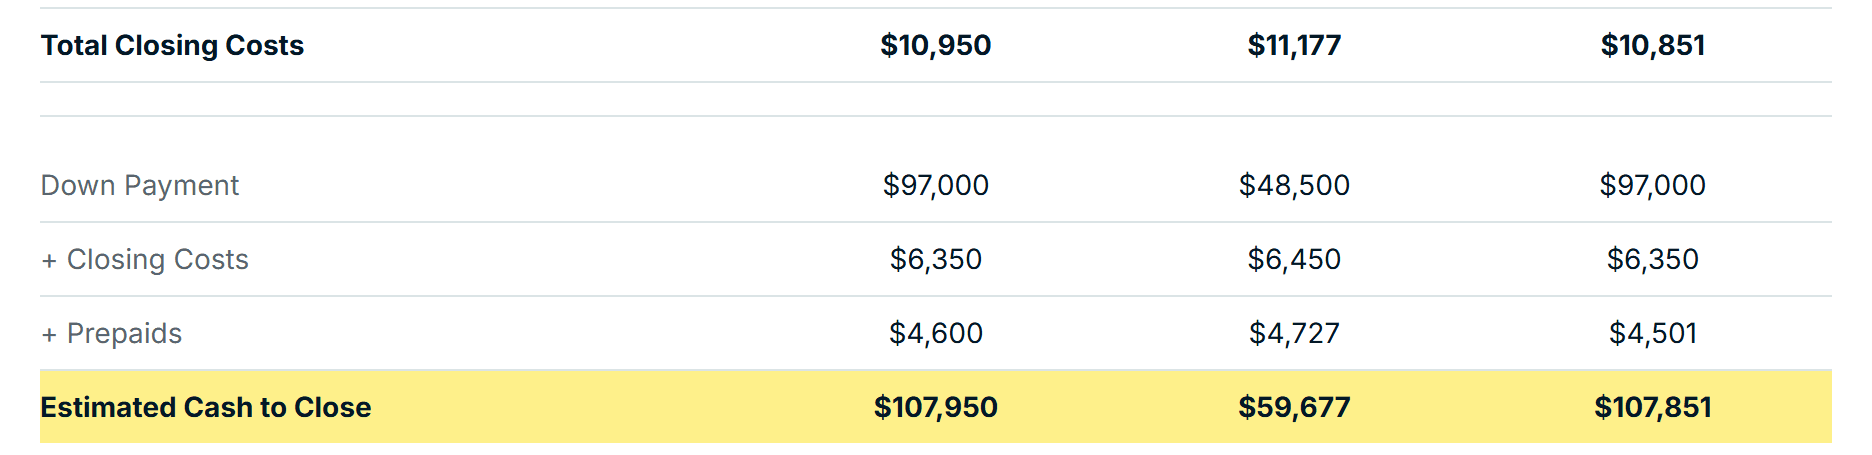
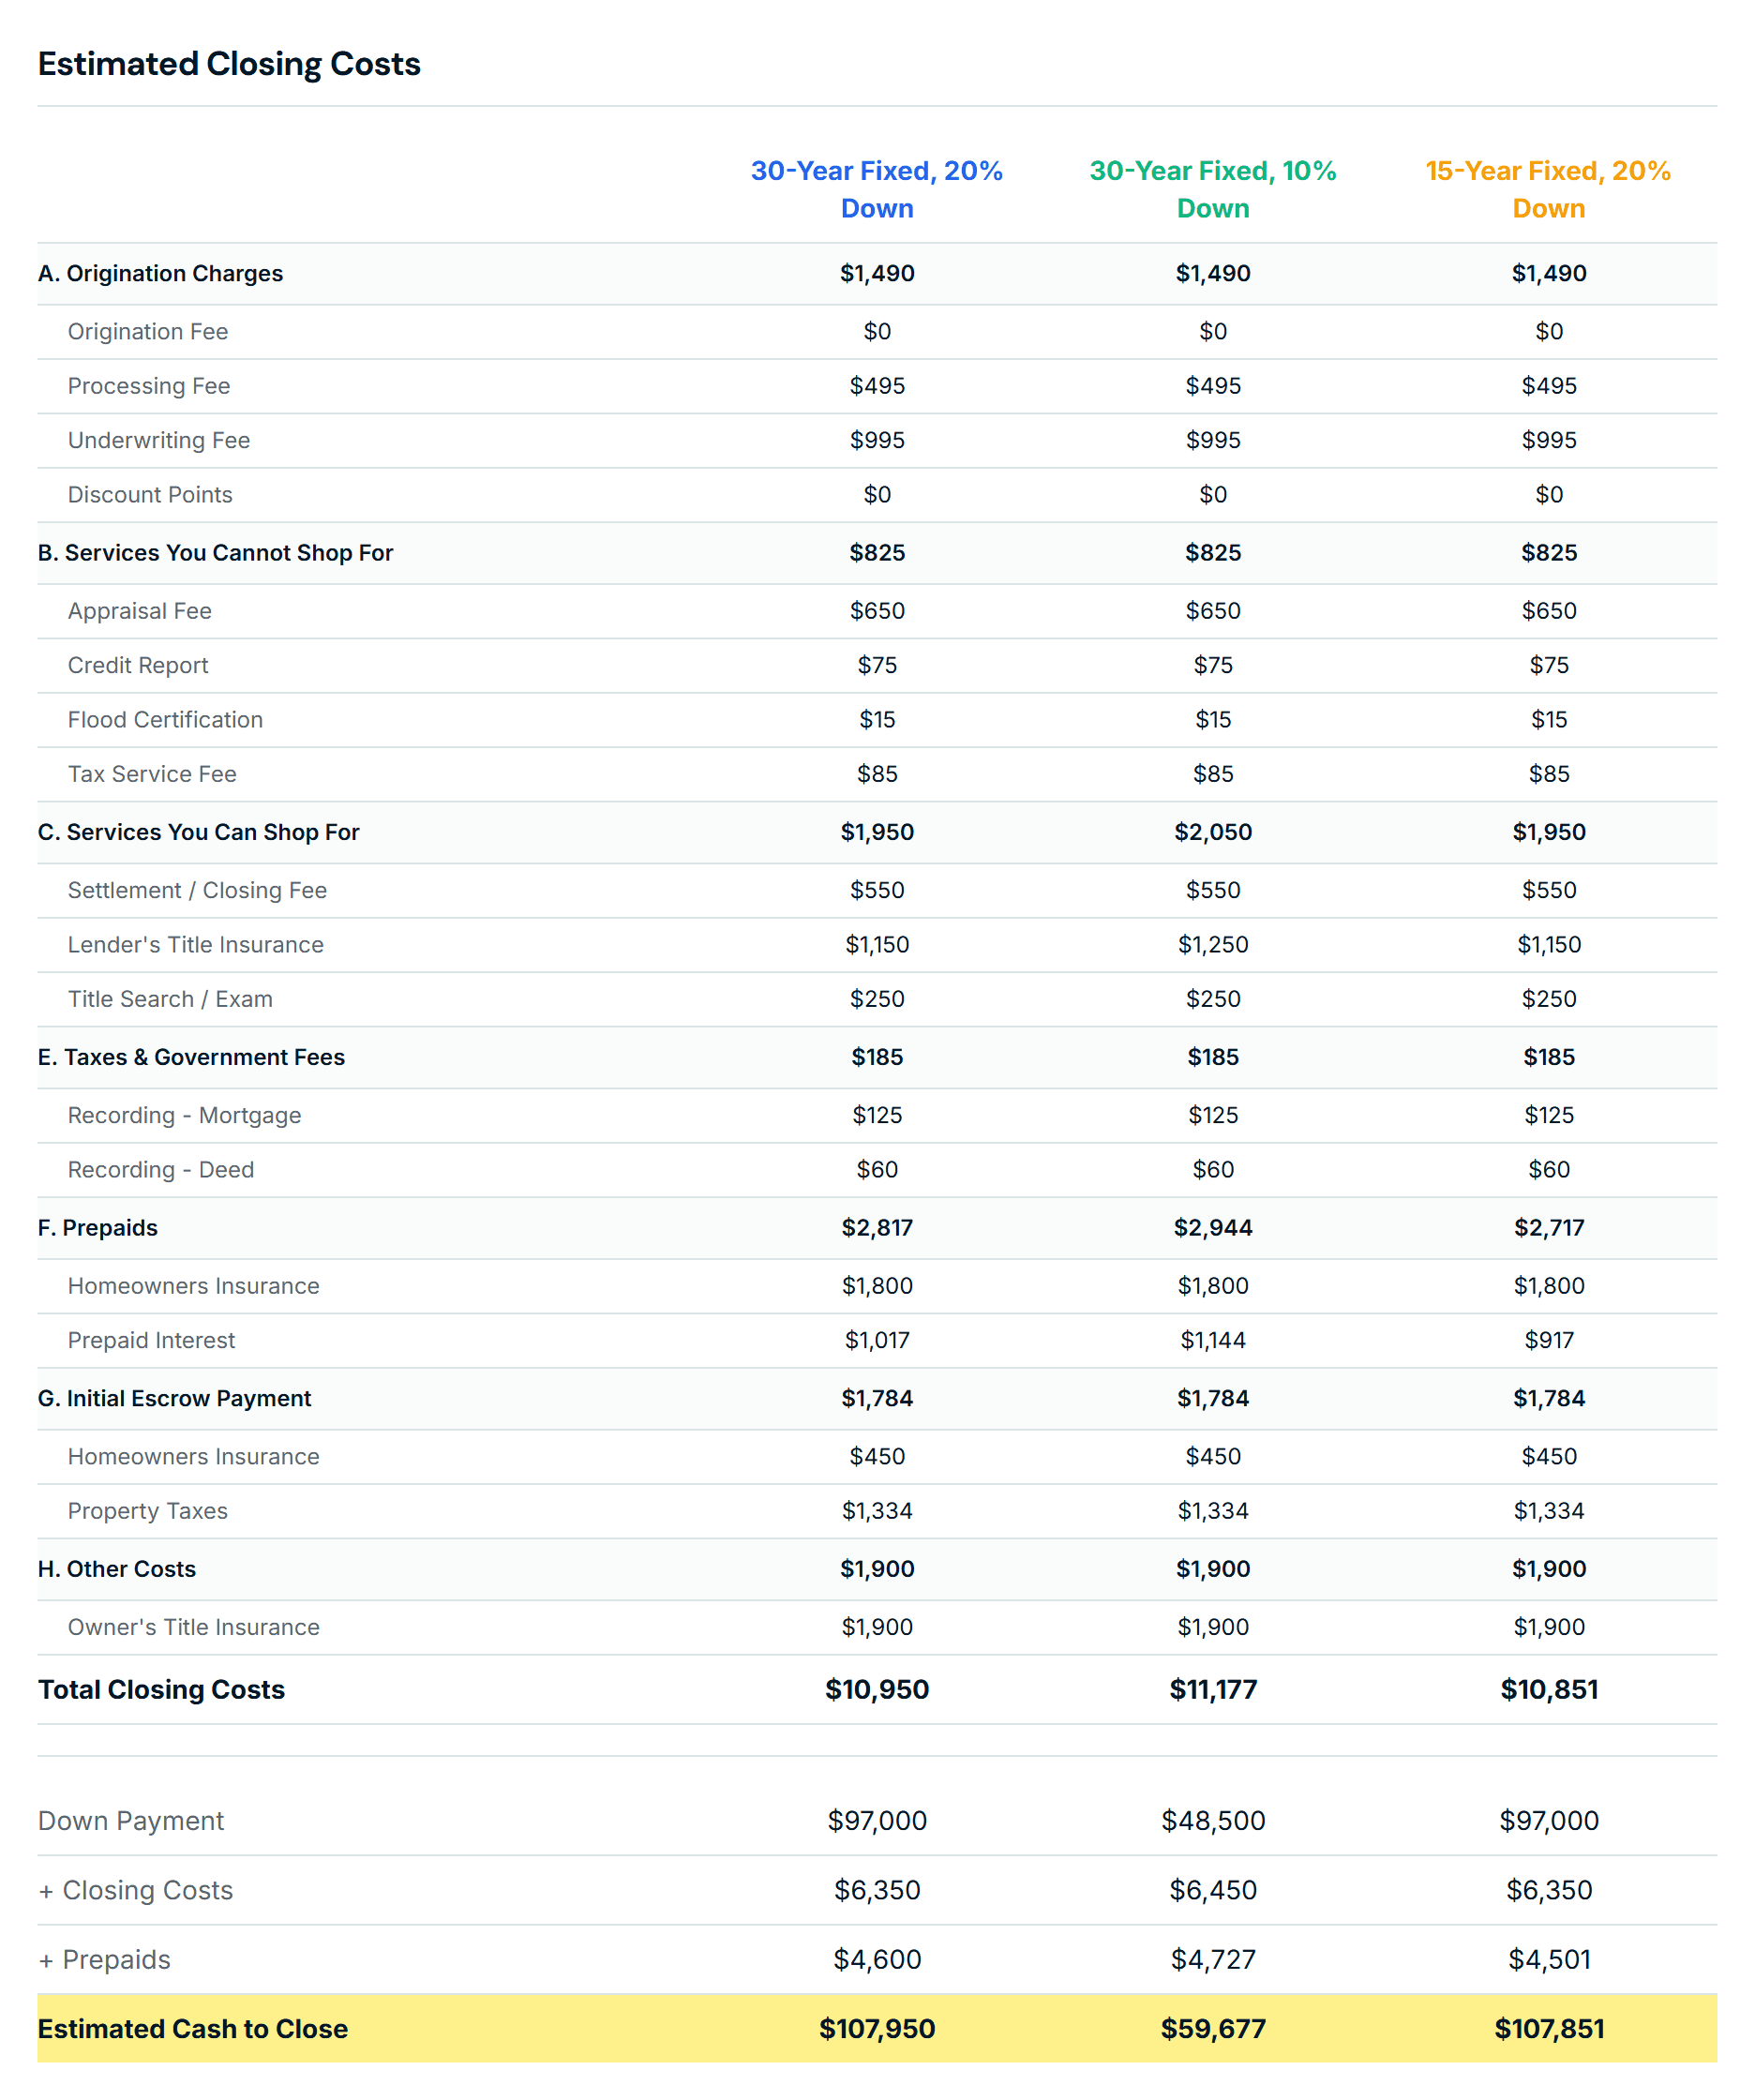
Estimated closing costs itemized by Loan Estimate section for three loan options, ending with down payment, closing costs, prepaids and estimated cash to close.
Closing costs itemized by Loan Estimate section, ending in the number the borrower needs: estimated cash to close.
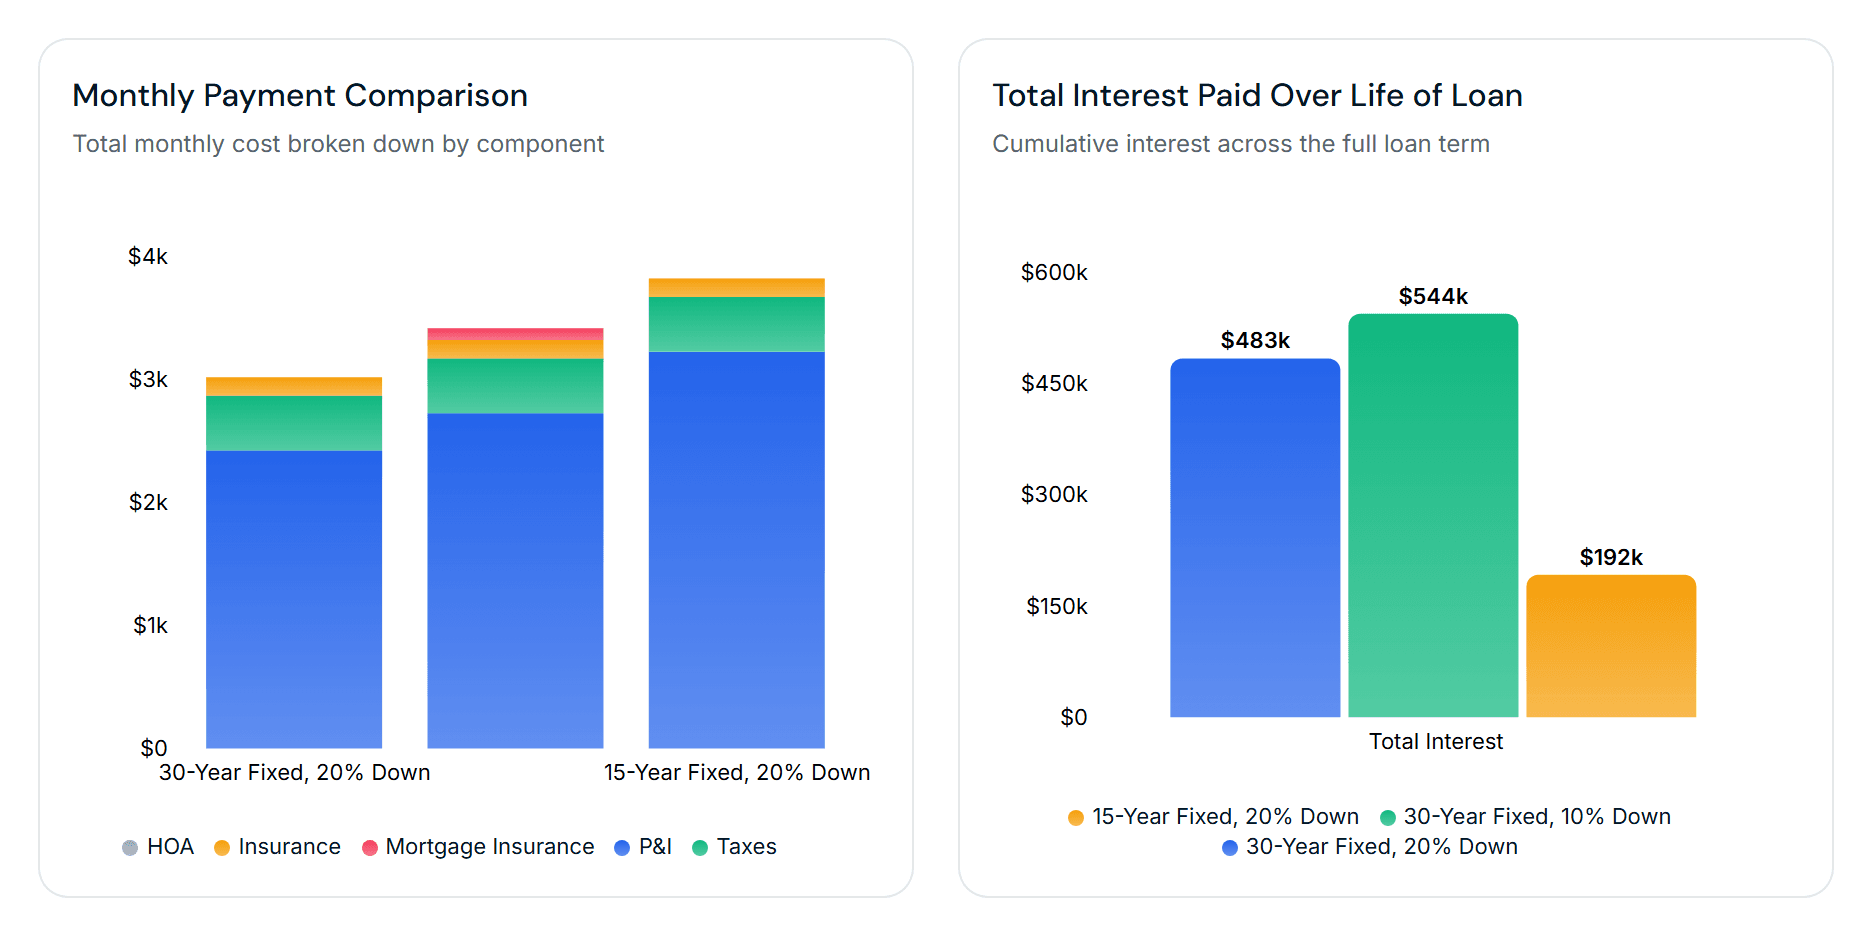
Two charts: monthly payment broken down by principal and interest, taxes, insurance and mortgage insurance for each option, and total interest paid over the life of each loan.
Charts for the payment breakdown and the total interest over the life of each loan.

The problem

Your borrowers have questions.Give them a better way to see the answers.

A borrower weighing two rates, two down payments and two sets of closing costs is holding six numbers that each change the others. Put that in a spreadsheet or a stack of loan estimates and most people stop reading.

MortgageDetail puts the same numbers in one place, in the same order, for every option. The borrower sees what changes and what it costs, and you spend the call on the question that matters instead of explaining the layout.

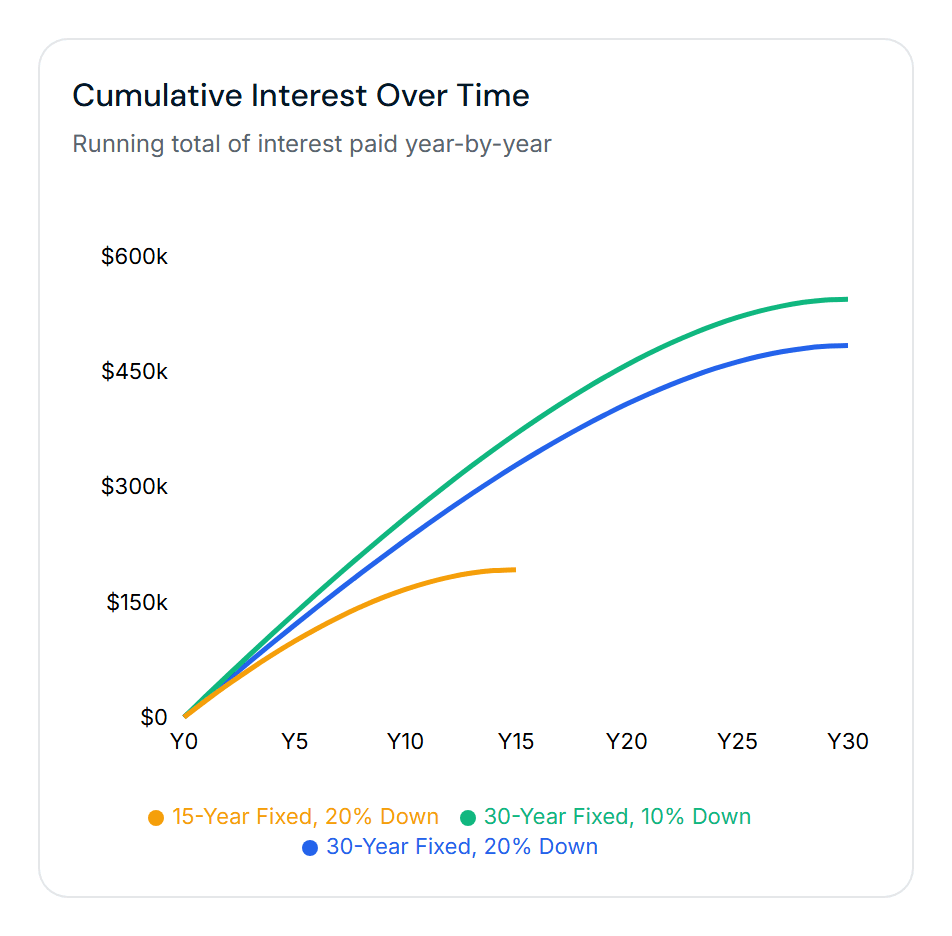
Cumulative interest over time for three loan options, showing the 15-year loan finishing at under two hundred thousand dollars while the 30-year options continue to five hundred thousand and beyond.
One chart answers the question every borrower asks about a 15-year loan.

What it does

Four things a borrower needs from a comparison.

Each one is a part of the same presentation, built from the scenarios you enter.

01

Compare loan options

Put up to four financing scenarios next to each other: different rates, terms, down payments or loan programs. Each option gets its own column, and every row lines up, so the borrower reads across instead of flipping between documents.

  • Conventional, FHA, VA and USDA, fixed and ARM
  • Buydowns, interest-only and balloon structures
  • One option marked as your recommendation
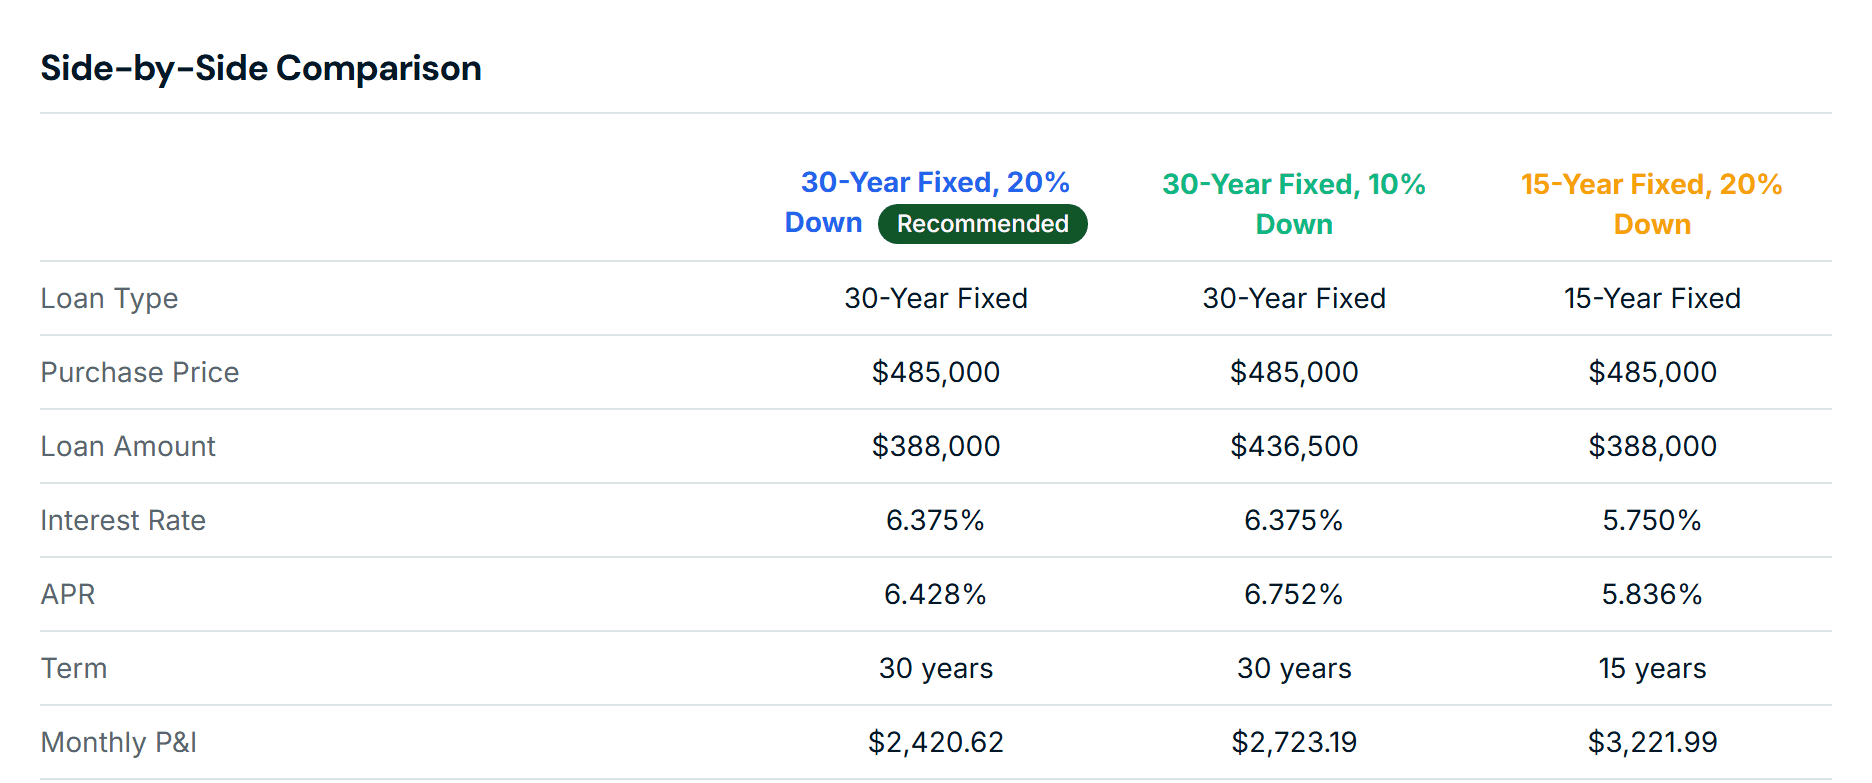
The top of a side-by-side comparison table showing three loan options with loan amount, interest rate, APR, term and monthly principal and interest.

02

Explain the complete cost

A payment is only part of the answer. Each option carries its own closing costs, prepaids and escrow, financed fees and mortgage insurance, so the borrower sees the monthly payment, the cash to close and the long-term cost together.

  • Loan Estimate sections A through H, itemized or summarized
  • Down payment, closing costs and prepaids rolled into cash to close
  • Total interest and total principal and interest for each loan
Closing cost summary rows: total closing costs, down payment, closing costs, prepaids and estimated cash to close for three loan options.

03

Make it yours

The presentation carries your name, headshot, title, NMLS number and contact details at the top, with your company logo. Your compliance designation, state license disclosures and custom disclaimer sit at the bottom, on every presentation you send.

  • Headshot, logo and contact details on the header
  • Equal Housing, Equal Housing Lender or Member FDIC designation
  • Notes to the borrower in your own words, plus co-branding with the referring agent
The header of a presentation showing a loan officer's headshot, name, title, NMLS number, phone, email and company logo.

04

Give borrowers more clarity

Charts and projections turn the table into a picture: how the payment breaks down, how much interest each option costs over time, how fast the balance falls and how equity builds. The borrower can see the trade-off before you explain it.

  • Monthly payment by component and total interest over the life of the loan
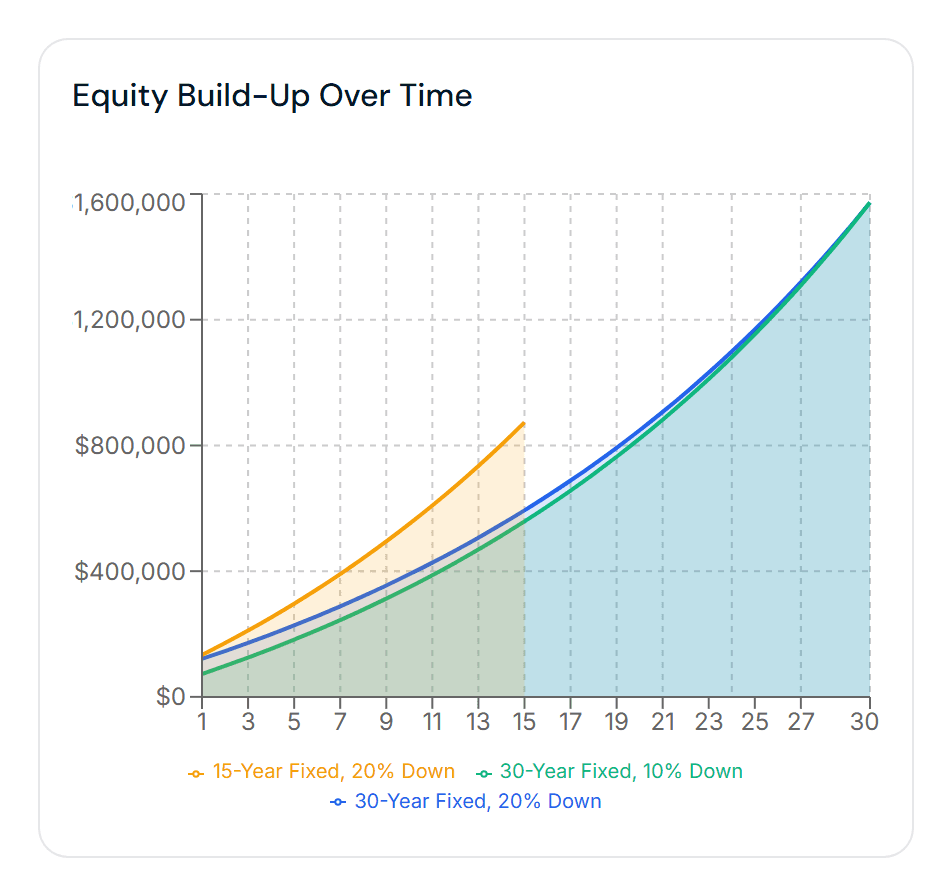
  • Cumulative interest, remaining balance and equity build-up over time
  • Year-by-year amortization schedule for any option
An equity build-up chart projecting home equity over thirty years for three loan options, with the 15-year loan building equity fastest.

How it works

From loan scenariosto a client-ready presentation.

There is no layout to design and no template to fight. You enter the scenarios; the presentation is the output.

  1. 1

    Enter your loan scenarios.

    Pick a presentation type, add the property and up to four scenarios. Principal and interest, mortgage insurance, APR and closing costs calculate as you type, and your default fees carry over to every new scenario.

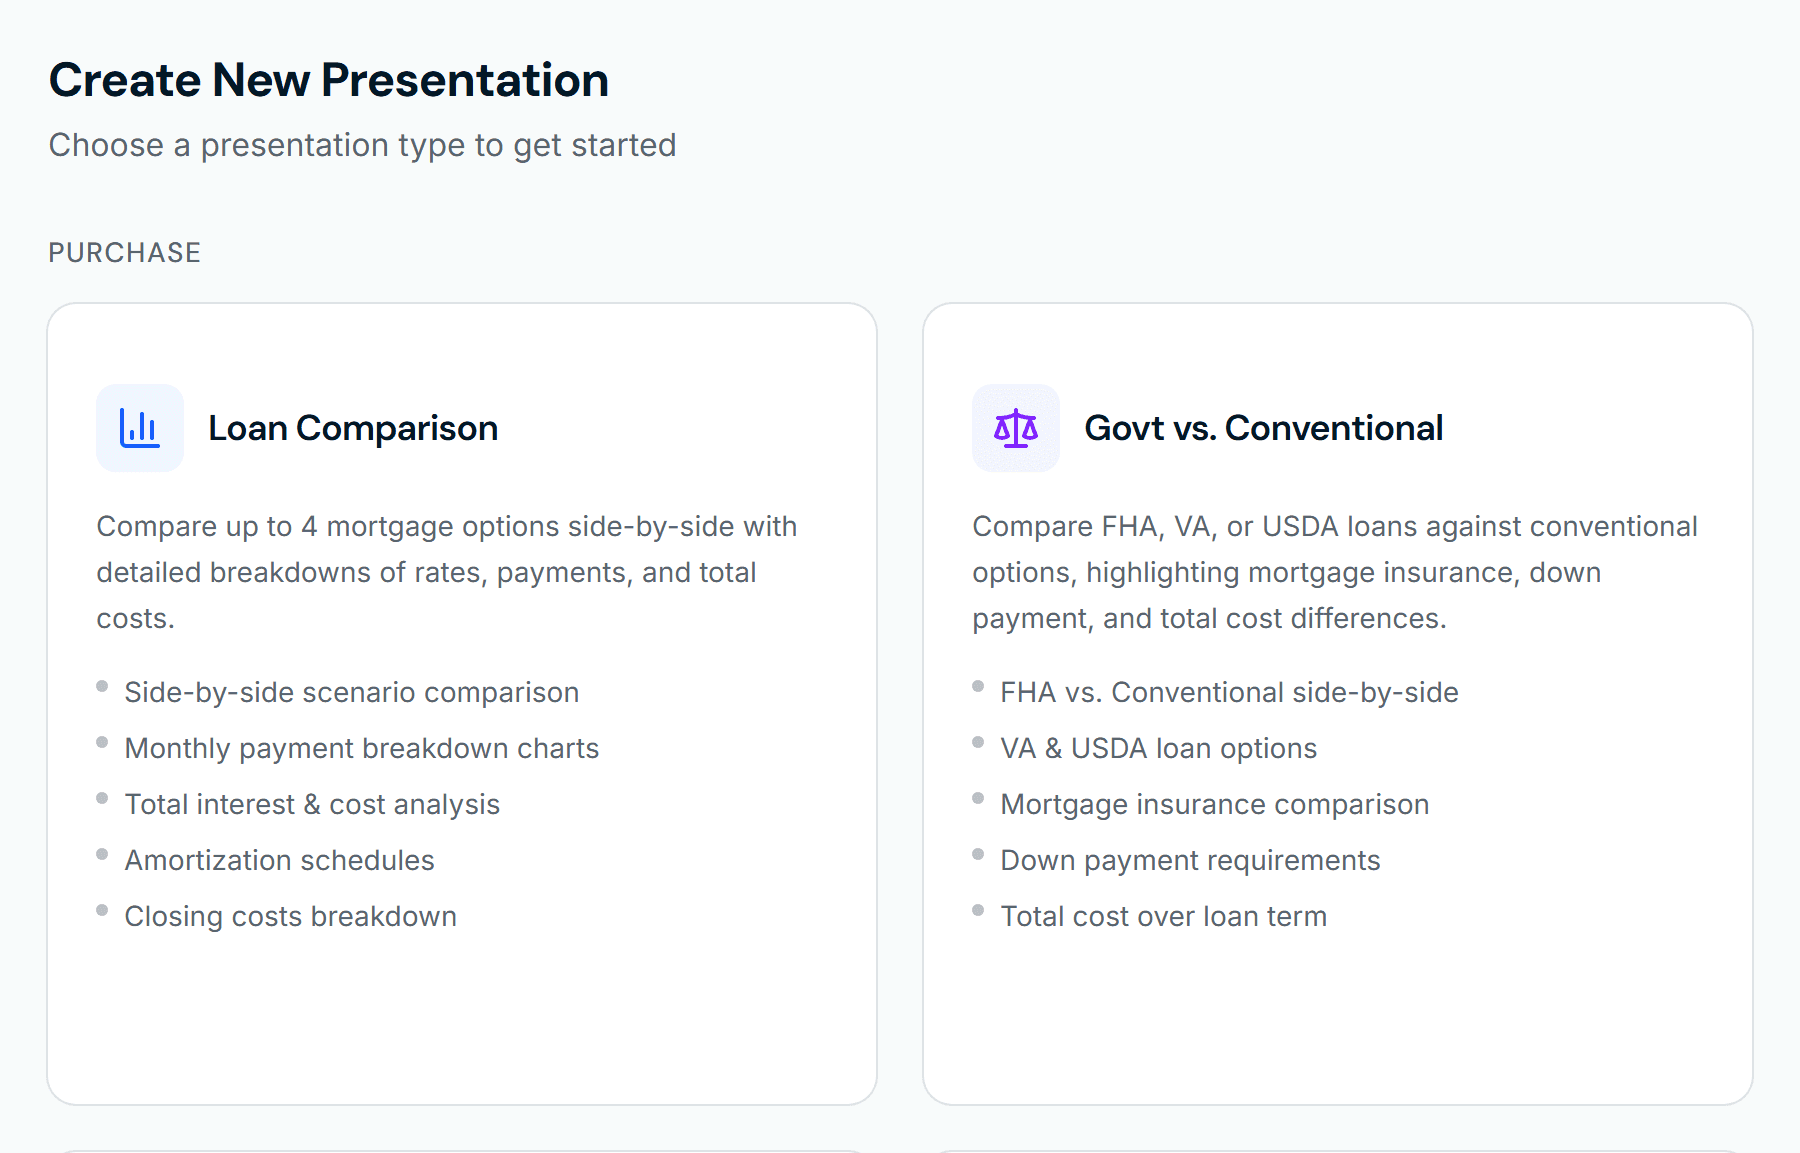
    The presentation type picker in MortgageDetail, showing the purchase presentation types: loan comparison, government versus conventional, down payment assistance and 80/15 versus PMI.
  2. 2

    Review your mortgage comparison.

    Preview the exact page your borrower will open. Mark a recommended option, highlight the rows you want them to notice, and add a note in your own words.

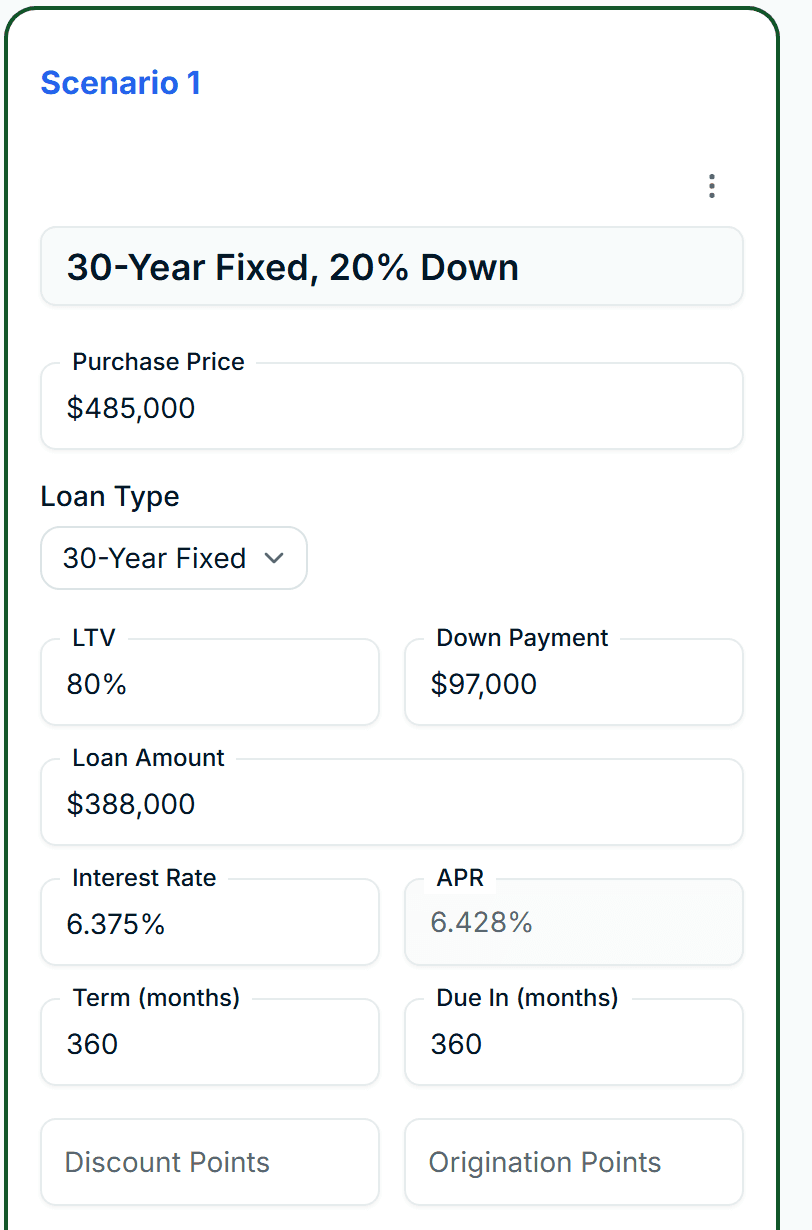
    The scenario editor with three loan scenarios side by side: purchase price, loan type, LTV and down payment, loan amount, interest rate with the calculated APR, and term.
  3. 3

    Send the presentation to your borrower.

    Set it live and copy the link. The borrower opens it in a browser with no login, and you get an email the moment they do. Add a password, or let the link stop working after a chosen number of days.

    The presentation preview with its toolbar: back to editor, views, live status, password, copy share link and print, above the branded presentation.

From the founder

A few years back I spent forty-five minutes on a Sunday night building a mortgage comparison in Excel for a client. He looked at it for ten seconds, said it was confusing, and went with the other lender.

After that I went looking for software that would do this better. The good ones cost $150 a month, and they put their own logo bigger than mine on the presentations I was sending to my own clients. That made no sense to me.

So I built this instead. It's $25 a month, or half that if you pay for the year. Your logo, your headshot, your NMLS. If you spend more than five minutes on a comparison after the first one, something is broken and I want to know about it.

David Ellison

Founder, MortgageDetail.com

Pricing

One plan. Everything you need.

No tiers, no per-presentation fees, no feature gates. Pay monthly, or pay for the year and get it for half.

Monthly

$25/month

Billed monthly. Cancel anytime.

Yearly

Save 50%

$150/year

$12.50 a month, billed once a year.

Everything included

  • Unlimited presentations
  • Up to four loan options side by side
  • Eleven presentation types, from purchase comparisons to refinance breakeven and rent vs. own
  • Conventional, FHA, VA, USDA, ARM, interest-only and buydown loans
  • Mortgage insurance, APR and closing costs calculated for you
  • Loan Estimate–style fee sheets, with fee worksheet import and title fee lookup
  • Charts, amortization schedules and long-term cost analysis
  • Your branding, compliance designation and disclaimers on every presentation
  • Live links with optional password and expiration
  • An email the moment a borrower opens the presentation
Start your free trial

3-day free trial. No credit card required. Cancel anytime.

FAQ

Questions loan officers ask.

How does MortgageDetail work?

You pick a presentation type, enter the property and up to four loan scenarios, and the numbers calculate as you go: principal and interest, mortgage insurance, APR, closing costs and cash to close. You preview exactly what the borrower will see, set it live, and send a link. When they open it, you get an email.

What types of loan scenarios can I compare?

Conventional, FHA, VA and USDA loans; fixed terms from 10 to 40 years; 3/1 through 10/6 ARMs; interest-only and balloon structures; and 3-2-1, 2-1, 1-1 and 1-0 temporary buydowns. Beyond the standard side-by-side comparison there are presentation types for government vs. conventional, down payment assistance, 80/15 vs. PMI, ARM vs. fixed, fast close vs. low rate, breakeven refinance, refinance with debt payoff, first and second refinance, investment property, and rent vs. own.

Can I customize the presentation?

Your headshot, name, title, NMLS number, phone and email sit at the top, with your company logo and NMLS. You choose the compliance designation (Equal Housing Opportunity, Equal Housing Lender or Member FDIC), add state license disclosures and a custom disclaimer, decide which charts to include, mark a recommended option, highlight any row, add notes for the borrower, and co-brand with the referring agent. A small "Powered by MortgageDetail" line appears in the footer.

Do borrowers need an account to open a presentation?

No. They open a link in any browser, on a phone or a computer. There is nothing to download and no login. If you want, you can add a password to a presentation, or set the link to stop working after a chosen number of days.

Can I send a PDF?

Presentations are built to be sent as a link, so the borrower always sees the current version and you can see when it was opened. Every presentation also has a Print button, and the browser's print dialog can save it as a PDF.

What happens when my trial ends?

The trial lasts three days and does not ask for a card. When it ends, you choose monthly or yearly billing on your billing page to keep building presentations. Your account and the presentations you have made stay in place, and links you have already shared keep working.

Can I cancel?

Yes, from your billing page, with no contract and no cancellation fee. Your access runs through the end of the period you have paid for.

Start today

Give your next borrower a better mortgage presentation.

See how MortgageDetail can make it easier to explain the numbers and help borrowers understand their options.